The numbers, not the spin, from nbn™'s half-year presentation and corporate plan
nbn™, the organisation building and operating Australia's national broadband network, is the subject of endless controversy.
So The Register has decided to try to assess it in a new way, with a scoreboard of the metrics that nbn™ offers in its results presentations, compared to those in its 2018-2021 corporate plan (PDF).
The results, and Vulture South's assessment of them, are in the table below.
But before we get there, we must consider the emphases nbn™ chose for this half-yearly announcement, plus an important metric we cannot measure.
The first matter is important because nbn™'s found some new jargon to champion: "customer experience". The company's decided that its decision to discount higher-speed wholesale plans was a customer experience effort and has paid off, with ISPs now happier to offer them to their retail customers. nbn™ also said doing so "is already seeing less congestion on the network" as users adopt higher-speed services.
Left unsaid is that nbn™ has built adoption of higher-speed services into its business plans, as they cost more to buy and will contribute to average revenue per-user (ARPU), a number the company needs to go higher to meet predictions and ensure it can become a going concern.
Which brings us to the metric that's hard to measure: whether users are signing up for different speed tiers at the rate nbn™ expects.
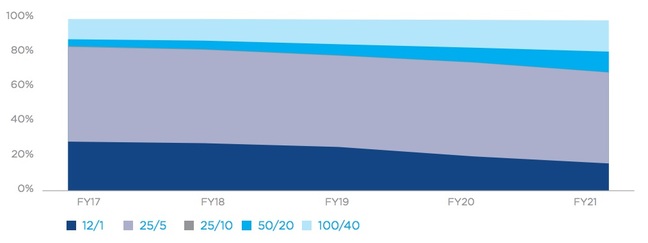
The company's corporate plan offered only the graph below, rather than firm numerical predictions.
nbn™'s H1 2018 presentation revealed that 30 per cent of users are on 12mbps/1mbps plans, 52 per cent on 25/5 and one per cent on 25/10, four per cent on 50/20 and 13 per cent on 100/40. Usage of 12/1 plans went up one percent over the half-year, while 25/5 went down.
When The Register squints at the graph from the corporate plan, we perceive lines that seem to predict the opposite behaviour was expected.
Whatever the real numbers from the plan, nbn™'s revenue assumptions need the graph to start sliding as predicted.
The company also said customer experience improvements have seen it make "improvements to home and business installations, new fault detection and resolution processes, enhanced case management timelines with retailers, and additional support and management for business customers."
That such improvements are needed is not in dispute. That poor design contributed to the need for backfill of those matters is, however, lamentable.
And now, on to the scoreboard:
So The Register has decided to try to assess it in a new way, with a scoreboard of the metrics that nbn™ offers in its results presentations, compared to those in its 2018-2021 corporate plan (PDF).
The results, and Vulture South's assessment of them, are in the table below.
But before we get there, we must consider the emphases nbn™ chose for this half-yearly announcement, plus an important metric we cannot measure.
The first matter is important because nbn™'s found some new jargon to champion: "customer experience". The company's decided that its decision to discount higher-speed wholesale plans was a customer experience effort and has paid off, with ISPs now happier to offer them to their retail customers. nbn™ also said doing so "is already seeing less congestion on the network" as users adopt higher-speed services.
Left unsaid is that nbn™ has built adoption of higher-speed services into its business plans, as they cost more to buy and will contribute to average revenue per-user (ARPU), a number the company needs to go higher to meet predictions and ensure it can become a going concern.
Which brings us to the metric that's hard to measure: whether users are signing up for different speed tiers at the rate nbn™ expects.
The company's corporate plan offered only the graph below, rather than firm numerical predictions.
nbn™'s H1 2018 presentation revealed that 30 per cent of users are on 12mbps/1mbps plans, 52 per cent on 25/5 and one per cent on 25/10, four per cent on 50/20 and 13 per cent on 100/40. Usage of 12/1 plans went up one percent over the half-year, while 25/5 went down.
When The Register squints at the graph from the corporate plan, we perceive lines that seem to predict the opposite behaviour was expected.
Whatever the real numbers from the plan, nbn™'s revenue assumptions need the graph to start sliding as predicted.
The customer is always … angry?
"Customer experience" has also been used as the justification for pausing the hybrid-fibre-coax rollout.The company also said customer experience improvements have seen it make "improvements to home and business installations, new fault detection and resolution processes, enhanced case management timelines with retailers, and additional support and management for business customers."
That such improvements are needed is not in dispute. That poor design contributed to the need for backfill of those matters is, however, lamentable.
And now, on to the scoreboard:
|
||||||||||||||||||||||||||||||||||||||||||||||||||
| And there you have it. nbn™ has kicked quite a few
goals of late. But gee it has a lot of premises to hook up between now
and June 30th, 2018, and the HFC pause won't help any. We'll update the scoreboard after nbn™'s next results presentation. For now, let us know what you think of this way of covering the never-ending fun that is the NBN. ® Source |
||||||||||||||||||||||||||||||||||||||||||||||||||
