
According to the scientific method, it is impossible to prove a theory is right. But climate alarmists ignore the scientific method and simply BELIEVE their theory is right. They don’t have time for any stinkin’ proof they are wrong.
This post is “stinkin’ proof” they are wrong. Yes, Virginia, it IS possible to prove a theory is wrong. Read to see how it is done.
The United Nations Intergovernmental Panel on Climate Change (IPCC) claims human emissions have caused ALL the increase in CO2 since 1750. They say it was 280 ppm in 1750 and human emissions caused it to rise to 410 ppm today.
IPCC claims human CO2 emissions have clogged the carbon cycle and thereby extended CO2 residence time in the atmosphere. IPCC (2007) wrote,
“The fraction of anthropogenic CO2 that is taken up by the ocean declines with increasing CO2 concentration, due to reduced buffer capacity of the carbonate system.”
The IPCC claims the outflow of CO2 from the atmosphere decreases with the level (concentration) of CO2 in the atmosphere, or
Outflow = constant / Level (1)
IPCC has inserted its claim into its climate models. IPCC’s Bern model is a curve-fit to the output of its climate models. The Bern model predicts 15 percent of human CO2 emissions remain in the atmosphere forever and 85 percent remains in the atmosphere much longer than IPCC’s natural residence time of 4 years.
These invalid IPCC claims are the basis of ALL the hype that human emissions cause climate change. These IPCC claims have cost taxpayers and our economy about a trillion dollars. Plus, the climate alarmists have lowered the level of America’s education and intelligence.
Data prove the IPCC claims are wrong.
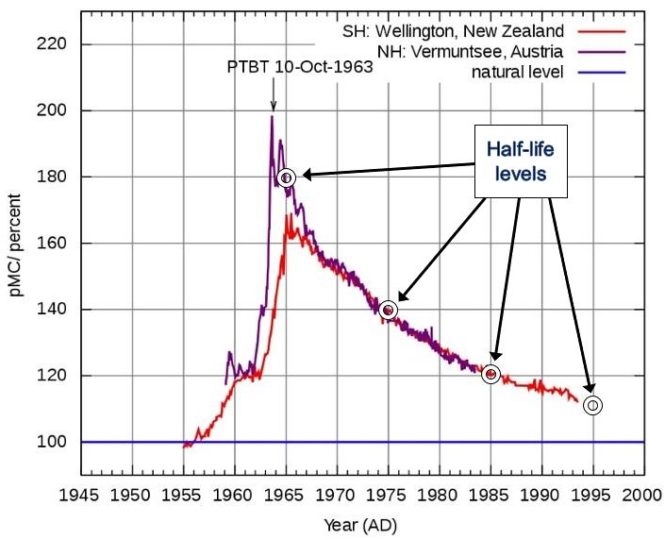
The 14C (that is an abbreviation of a carbon atom with 6 protons and 8 neutrons) data from the atomic bomb tests in the 1960’s contradicts the IPCC climate change theory and its claims. The 14C in the atmosphere is in the form of 14CO2 (that is an abbreviation of a CO2 molecule with a 14C carbon atom). The bomb tests increased the level of 14CO2 by over 80 percent.
After the termination of the tests in 1963, the 14C level decreased smoothly toward its former equilibrium level of 100 percent. Specifically, the 14C level decreased by one-half its level above 100 percent every ten years from 1965 to 1995.
The following chart shows the 14C data and the half-life levels.
A simple model matches the 14C data.
Here is a very simple model that reproduces how 14C decreased with time. It begins with the reliable continuity equation,
dL/dt = Inflow – Outflow (2)
where
L = the level (concentration) of CO2 in the atmosphere
t = time in years
Then it adds the assumption that the outflow of 14CO2 equals the level divided by the 1/e residence time, Te, or
Outflow = L / Te (3)
Equation (3) is the inverse of the IPCC claim shown in Eq. (1). Inserting Eq. (3) into Eq. (2) gives,
dL/dt = Inflow – L / Te (4)
To find Inflow, let dL/dt equal zero. Then L will equal its equilibrium level, Le, and Inflow becomes,
Inflow = Le / Te (5)
So, the final model equation is
dL/dt = (Le – L) / Te (6)
where
Le = the equilibrium level when Outflow equals Inflow
Equation (6) has the analytic solution,
L = Le + (Lo – Le) exp(- t / Te) (7)
The 14CO2 molecules trace the same carbon path as the more abundant 12CO2 molecules, although 14CO2 will react slower than 12CO2 because it is heavier.
The simple model proves the IPCC is wrong.
Equations (6) and (7) exactly reproduce the 14C data. This proves 14CO2 molecules exit the atmosphere according to model Eq. (3) and not according to IPCC’s Eq. (1). So, the 14C data prove outflow is proportional to level and not proportional to the inverse of level as IPCC claims. Since the IPCC theory does not predict the 14C data, the IPCC theory of climate change is wrong.
Furthermore, the model proves human emissions have not reduced the “buffer capacity of the carbonate system” as the IPCC claims. IPCC’s Bern model is wrong. Therefore, IPCC climate models are wrong.
The level of atmospheric CO2 measured at Mauna Loa was 320 ppm in 1965 and 360 ppm in 1995. This increase in the level of CO2 did not affect the transfer of 14CO2 during that period.
The simple model shows CO2 in the atmosphere behaves like water in a lake.
Natural and human CO2 emissions change the level of CO2 in our atmosphere the same way a river that flows into a lake changes the level of the lake. If a river flows into a lake and lake water flows out over a dam, the river inflow simply raises the level of the lake until the outflow over the dam equals the inflow from the river. Then the lake level remains constant so long as inflow remains constant.
Similarly, natural and human CO2 emissions simply raise the level of CO2 in the atmosphere until CO2 outflow equals CO2 inflow. Then the level of CO2 in the atmosphere remains constant so long as inflow remains constant. Equation (6) proves that is the case.
The following figure illustrates what the simple model tells us. Inflow sets the equilibrium level of CO2 in the atmosphere, according to Eq. (5). The level sets the outflow, according to Eq. (3). And level moves toward its equilibrium level until outflow equals inflow, according to Eqs. (6) and (7). Then the level stays constant until inflow changes.
The simple model and the above figure apply to human and natural CO2 inflows both independently and in total. The inflows create their own equilibrium levels, which add together.
The simple model shows the ratio of human to natural equilibrium levels is equal to the ratio of their inflows. This means natural CO2 emissions cause 392 ppm of today’s CO2 level and human CO2 emissions cause only 18 ppm, for a total of 410 ppm today. If all human emissions were totally stopped and natural emissions remained constant, the level of CO2 in the atmosphere would fall by only 18 ppm in about 20 years.
Therefore, Eq. (6), supported by the 14C data, proves IPCC’s fundamental claim that human emissions have caused all the increase in CO2 since 1750, is wrong.
The Bern model contradicts data.
The following plot shows how the Bern model, which simulates climate models that use IPCC assumption of Eq. (1), produces a very different future CO2 scenario than Eq. (6) which reproduces the 14C data.
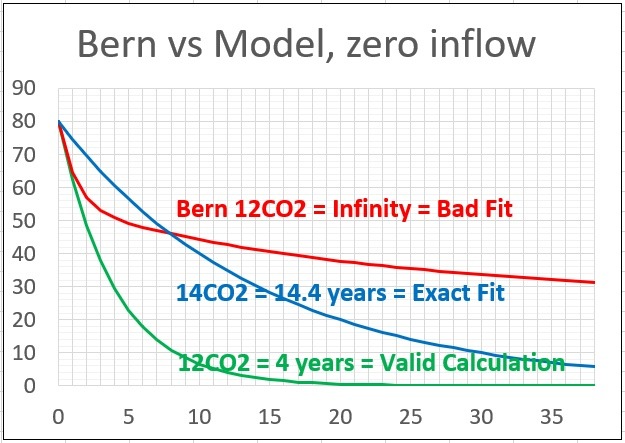
- In blue: Equation (6) exactly reproduces the 14C data. The 14CO2 curve falls from 80 to 40 in 10 years, a half-life that equals the 1/e residence time of 14.4 years.
- In green: Equation (6) predicts the curve for 12CO2. The 12CO2 curve falls from 80 to 40 in 2.8 years, a half-life that equals the 1/e residence time of 4 years.
- In red: The Bern model curve initially follows the 12CO2 curve but then flattens out because it assumes human emissions remain in the atmosphere.
Some scientists argue that the simple model cannot be accurate because it neglects chemical reactions outside the atmosphere. These scientists do not understand how to use systems.
The simple system for the atmosphere includes external effects through inflow and outflow. Think about it rationally. The only way an external process can affect the level of CO2 in the atmosphere is by affecting inflow or outflow. The model does not need to include the specifics of external processes. It only needs to include the ways external processes can change the level which is by inflow or outflow.
In the philosophy of science, Occam’s Razor says the simplest explanation of anything is more likely to be the accurate explanation.
The simple model shows how inflow affects level, how level affects outflow, and how balance occurs when outflow equals inflow. Nothing in the world outside the atmosphere changes these conclusions. But these conclusions change entirely the dominant worldview of how human emissions change the level of CO2 in our atmosphere.
Conclusions
IPCC’s claim that human emissions caused all the rise in atmospheric CO2 since 1750 is, without question, the most costly deception in the history of mankind. People think they can save the world if they can stop human emissions of CO2, but data and simple physics prove them wrong.
Climate alarmists have money, critical government jobs, control of scientific organizations and journals, influential university positions, and well-funded environmental organizations.
The truth will prevail … when we get money to support the dissemination of the truth.
Source